How it works › Where the work goes
Charts
Tap the chart icon on any exercise or category to explore your history. Charts open in fullscreen and rotate to landscape on mobile.
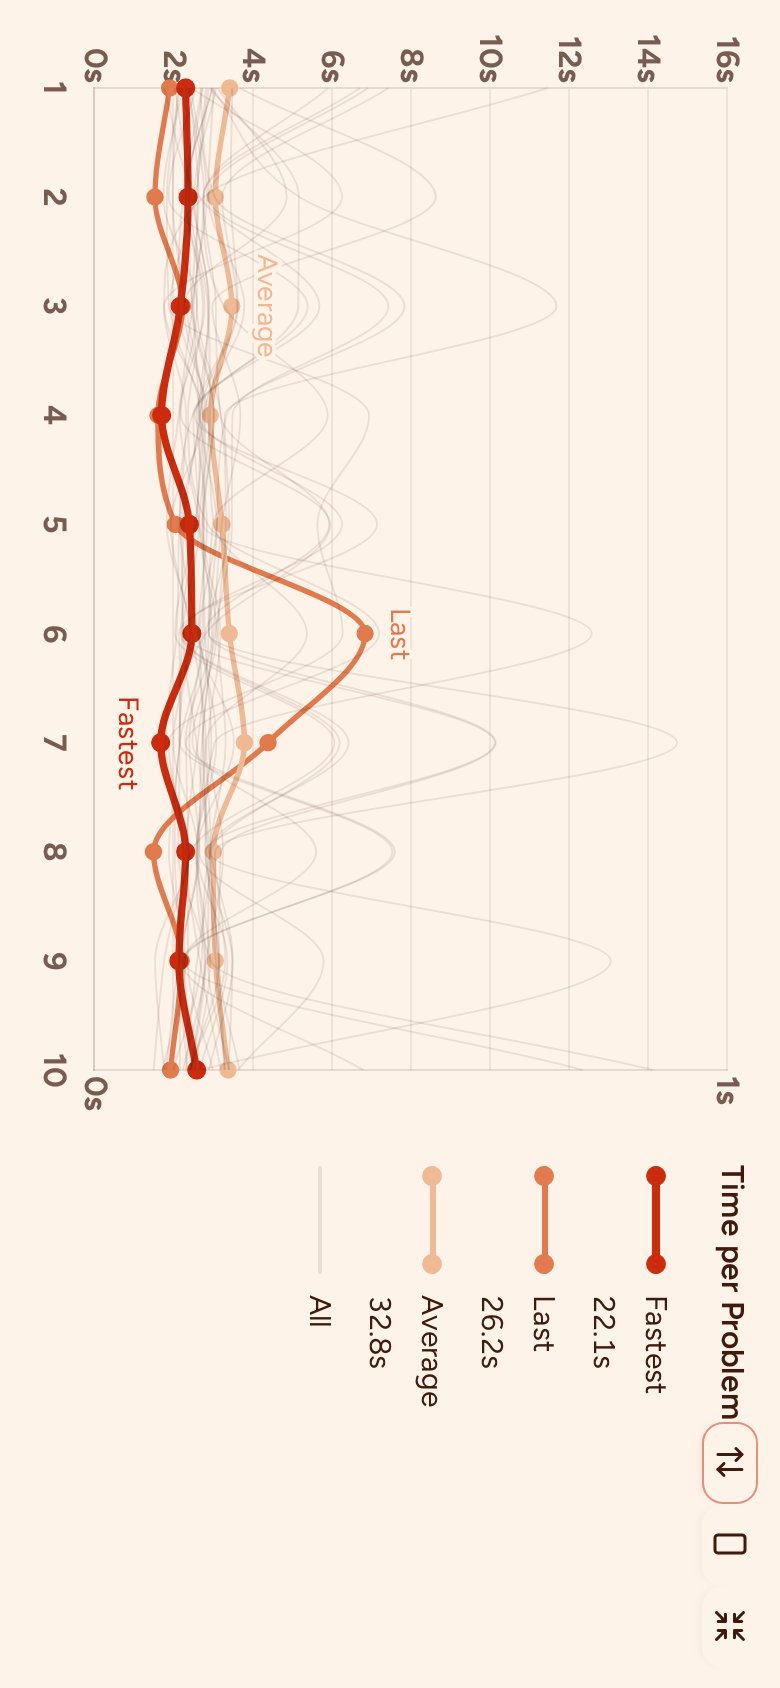
Time per problem
Each line is one run. Compare at a glance whether you were faster or slower per problem than before. Use the toggle to zoom out and show the full time range, including slower outlier runs.
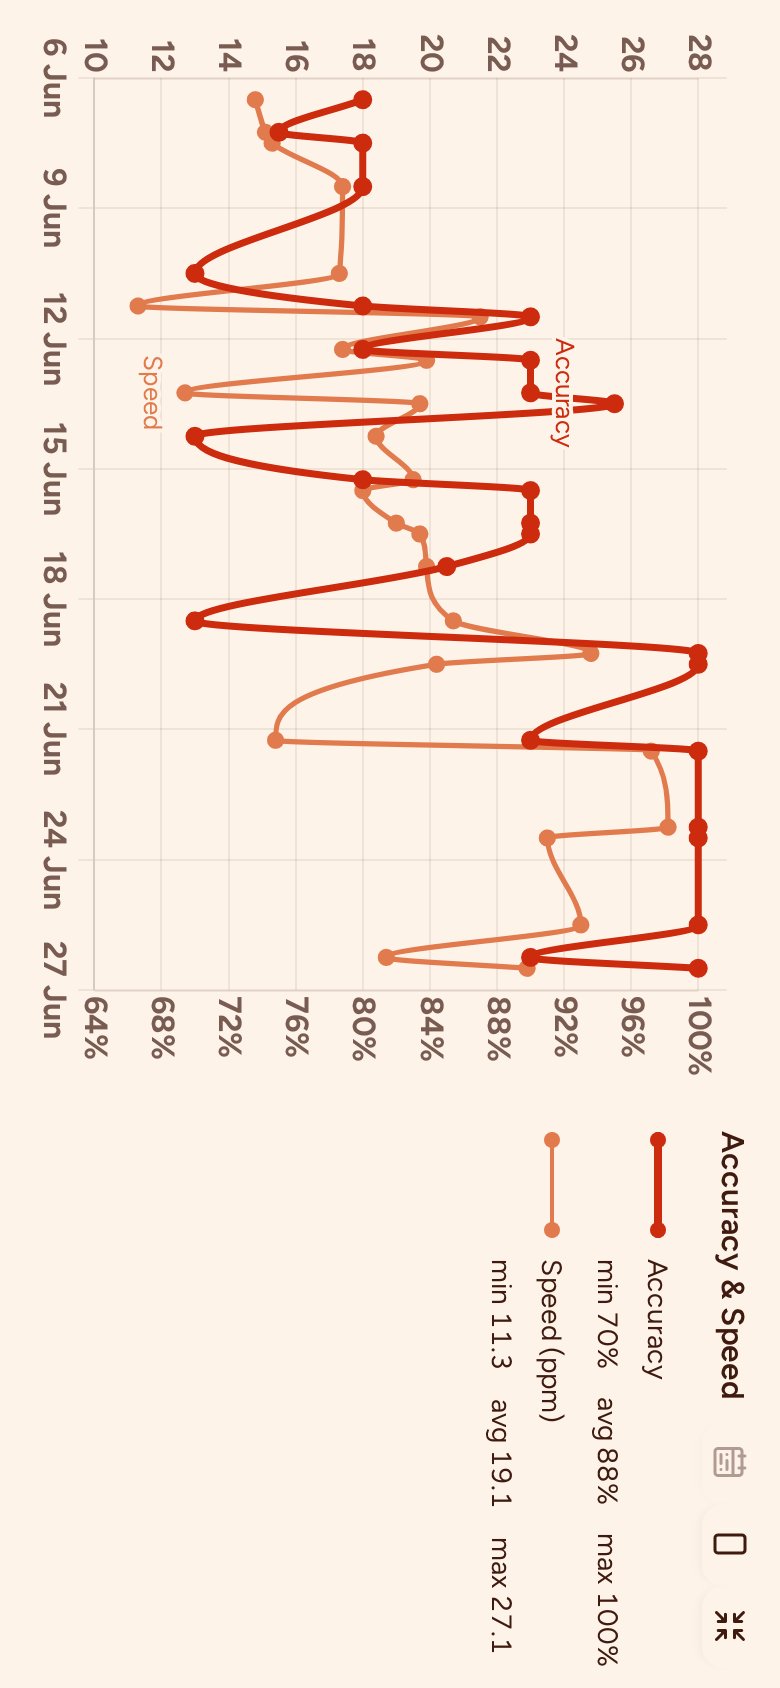
Accuracy & speed
A line chart showing your accuracy percentage and problems per minute over time, grouped into time buckets. Use the calendar toggle to show the entire time window.
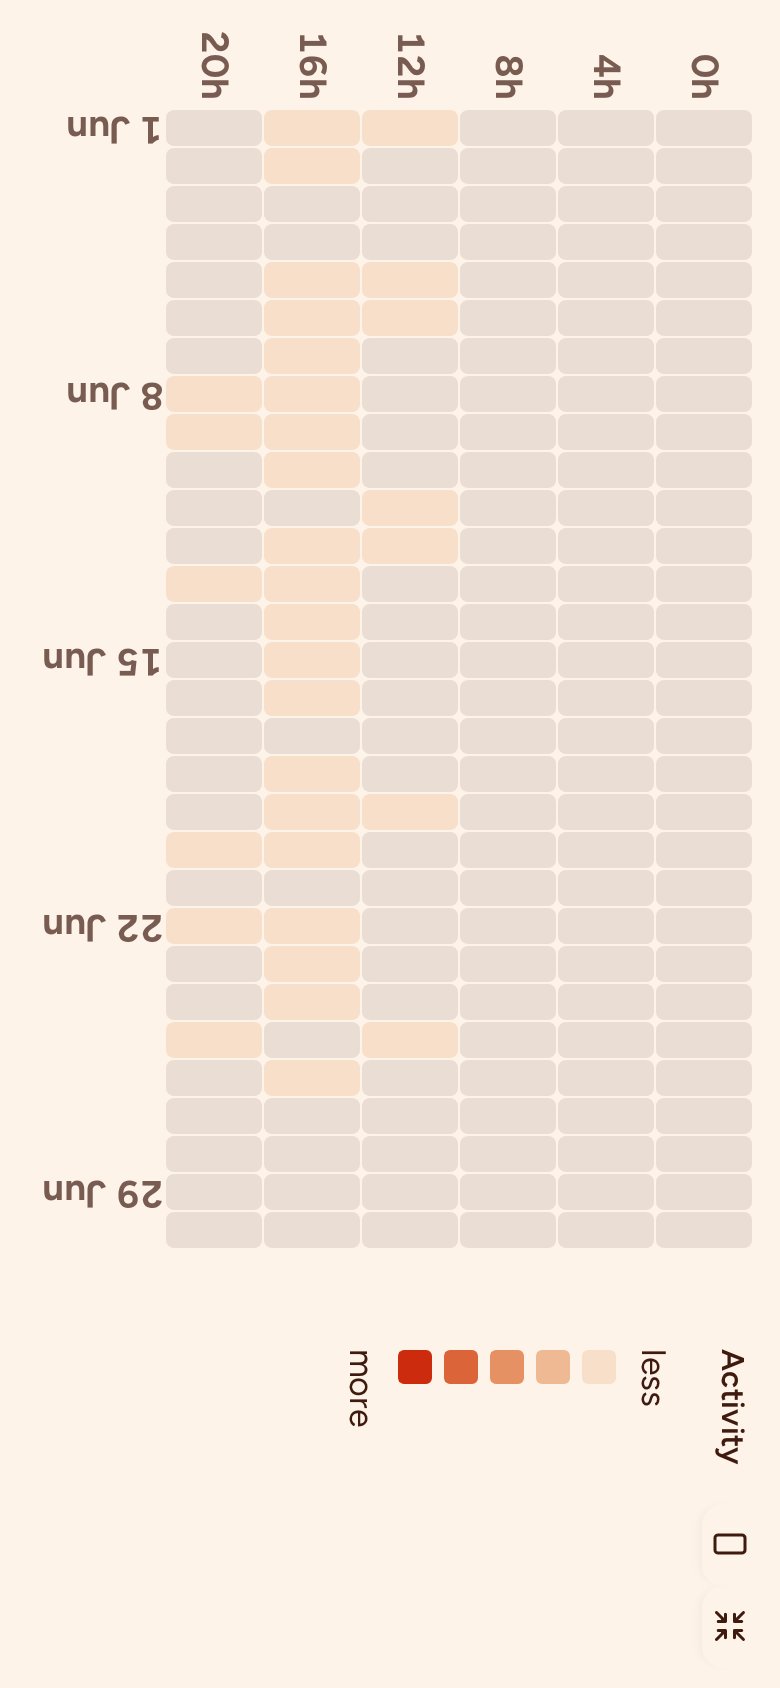
Activity
A grid showing when you solve the most problems within the current time window.
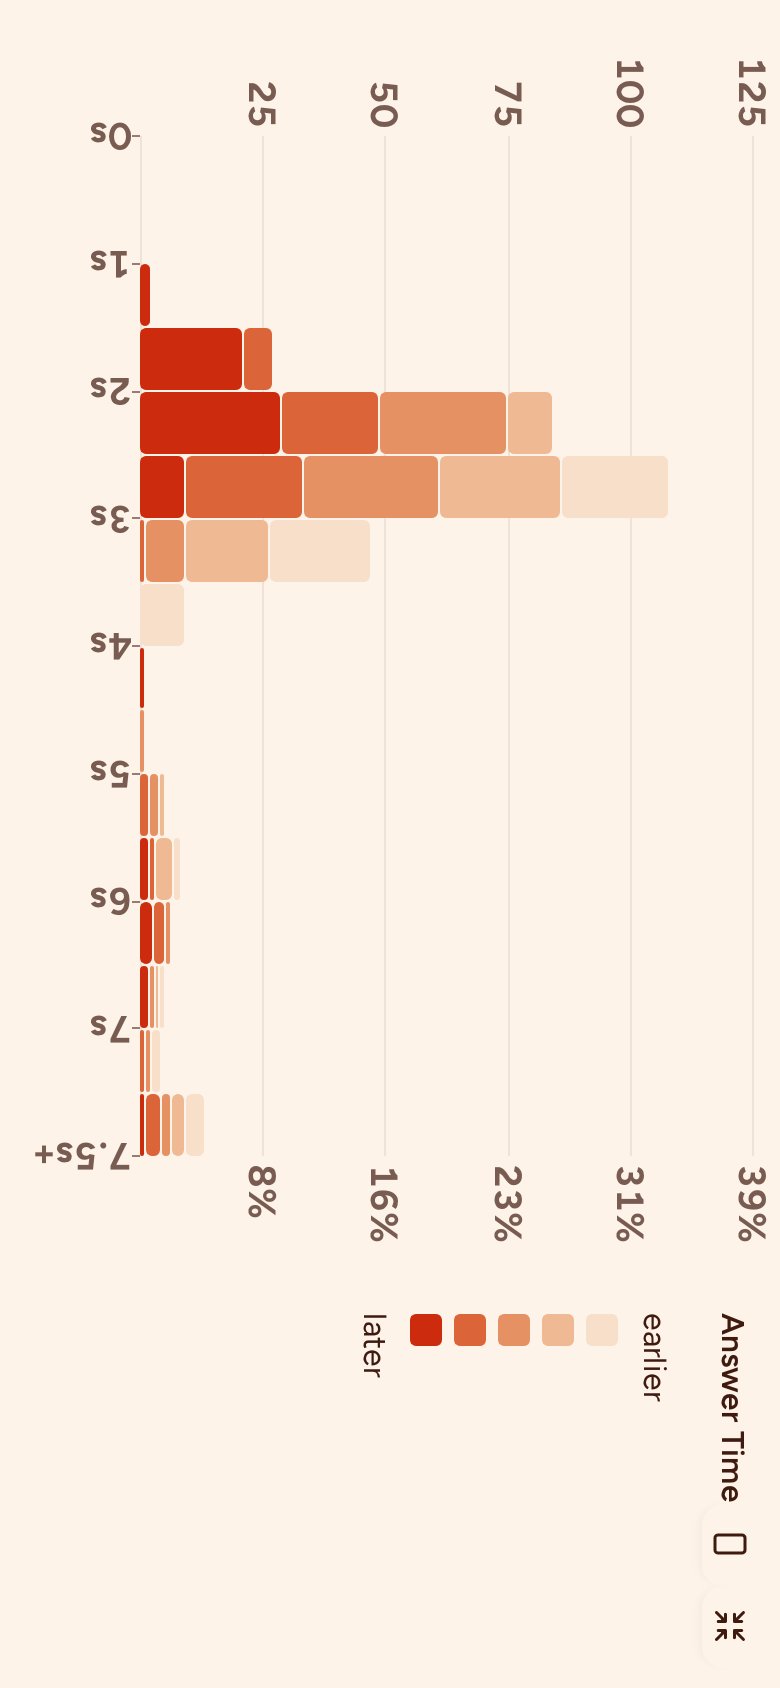
Solve time
A histogram showing how individual problem solve times are distributed across all your runs.
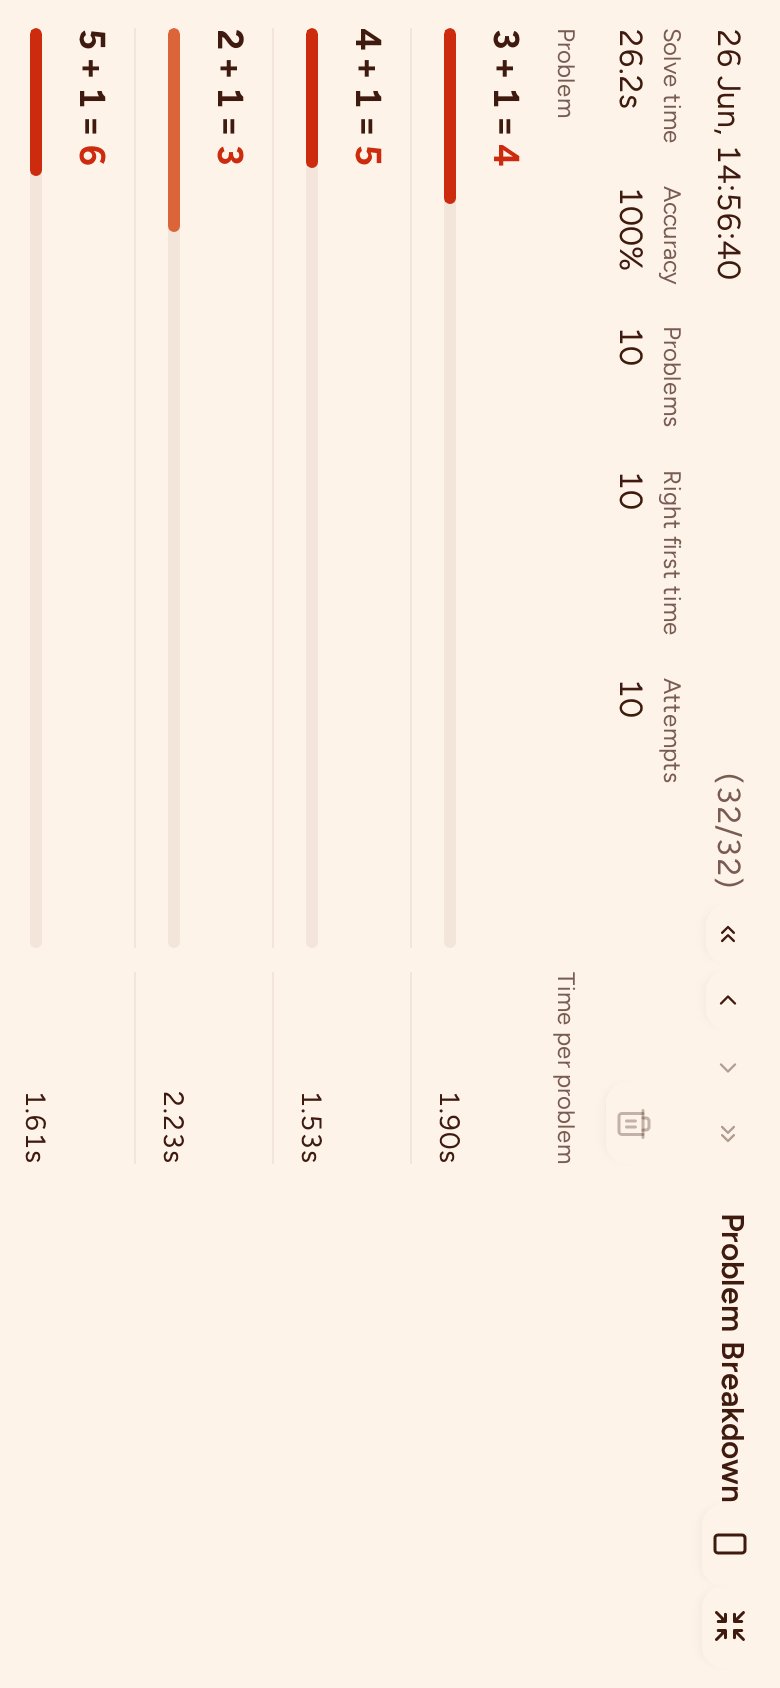
Run in detail
Step through past runs one by one. For each run you can see every problem, the answer you gave, any wrong attempts, and how long it took.
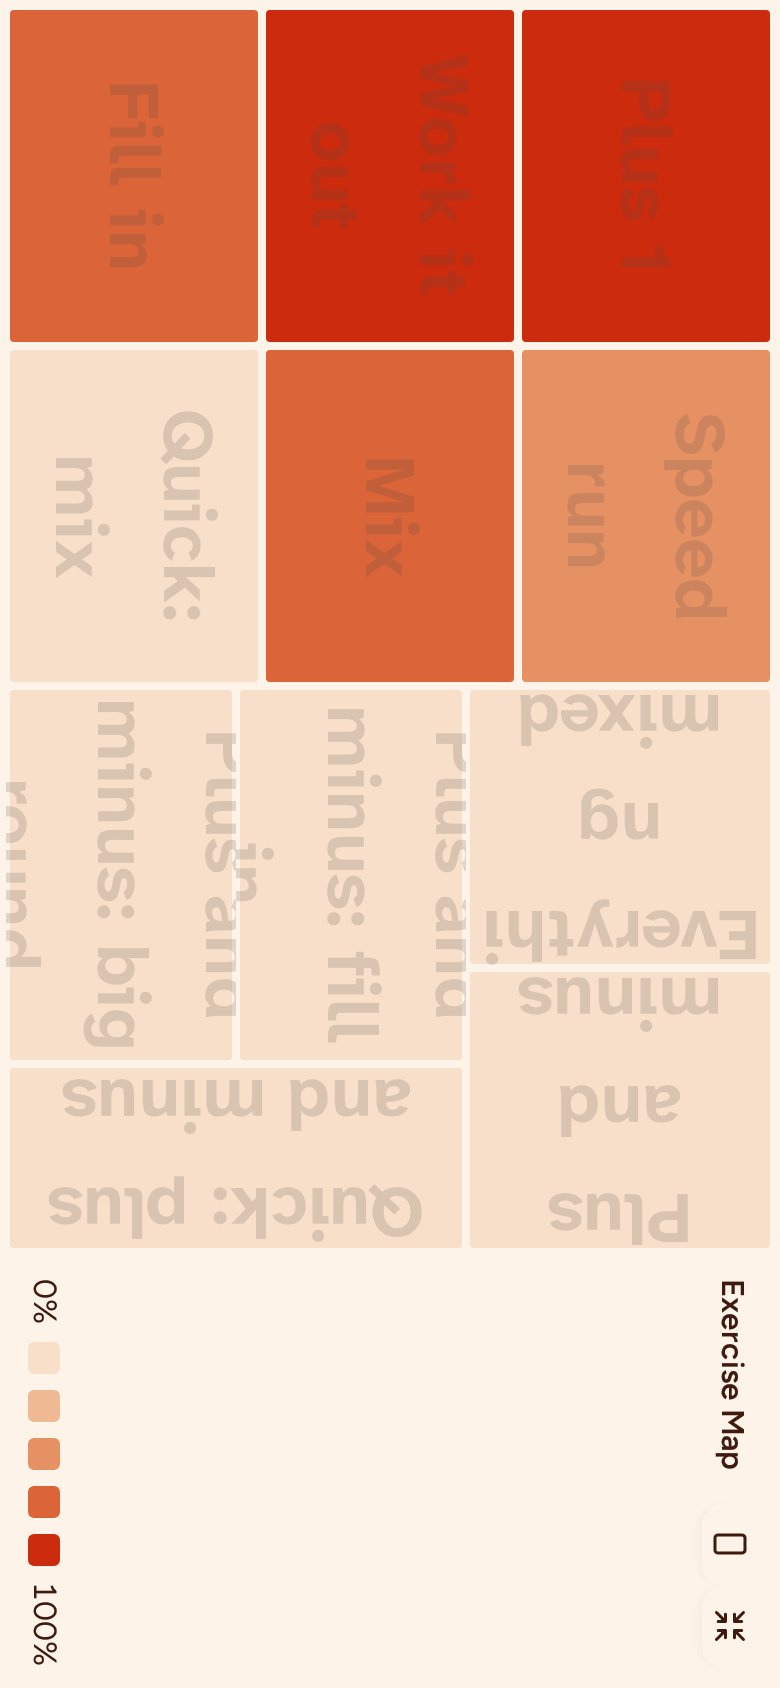
Exercise map
A treemap of the exercises you've played in a category, shaded by how close each is to completion and sized by how often you played it. Use the toggle to see every exercise in the category, including ones you haven't unlocked yet, all shown at equal size.